AI SECURITY WORKBENCH
Capture, Replay & Runtime Evidence
Turn AI runtime behavior into reviewable evidence.
Runtime Trace captures supported observations across prompts, retrieval, model calls, tools, identities, approvals, policy decisions, outputs, and consequential side effects so teams can reconstruct behavior, investigate findings, validate controls, and define retest conditions.
Configured runtime visibility
Capture the events exposed by the selected deployment, instrumentation, authorization, and supported integrations.
Structured evidence records
Preserve supported observations with timestamps, scope, provenance, and applicable redaction.
Replay & Test
Replay any trace into the Range for regression and adversarial testing.
Review and assurance export
Export structured records for review, control validation, investigation, and retesting.
AI Security Workbench · AI Workflow and Runtime Evidence
Runtime Trace
Configured runtime visibility
Capture the events exposed by the selected deployment, instrumentation, authorization, and supported integrations.
Structured evidence records
Preserve supported observations with timestamps, scope, provenance, and applicable redaction.
Replay & Test
Replay any trace into the Range for regression and adversarial testing.
Review and assurance export
Export structured records for review, control validation, investigation, and retesting.
Core capabilities
What Runtime Trace does.
Configured interaction capture
Capture supported prompts, responses, retrieval events, tool calls, approval events, provider hints, errors, and outputs available within the configured observation boundary.
160+ Payload Normalizers
Normalize messy payloads from OpenAI, Anthropic, Gemini, local models, and chatbots into a single AI Security Event schema. Stop correlating JSON from six different vendor formats.
PII & Secret Redaction
Automatically detect and redact secrets, PII, credentials, and regulated data before evidence is stored or shared. Built on Presidio for named-entity recognition across AI payloads.
Trace Timeline Reconstruction
Reconstruct AI interaction timelines from captured events. See the full causal chain: user input → prompt → context retrieval → tool invocation → response streamed → evidence packaged.
Evidence Bundle Export
Export as Trace JSON (Redacted), Evidence Pack (ZIP), Control Mapping (CSV), or Replay File. Ready for product security reviews, AppSec, GRC, legal holds, and incident response.
Regression Fixture Generation
Turn any captured trace into a replayable test case. Feed directly into Adversarial Range for prompt injection testing, scenario rerun, and ongoing regression validation.
Evidence & signals
What you get out of the box.
Trace Timeline Events
- Prompt Captured
- Context Retrieved
- Tool Call Observed
- Response Streamed
- Approval Event
- Evidence Pack Generated
What it produces
- Redacted trace JSON
- Evidence pack ZIP
- Control mapping CSV
- Replay file
- Timeline summary
- Retest fixture
Export Formats
- Trace JSON (Redacted)
- Evidence Pack (ZIP)
- Control Mapping (CSV)
- Replay File (Trace)
Red team + Blue team
Built for both sides of the security equation.
Red Team Use
- Show exactly how data moved through the system during a prompt injection or leakage event
- Replay captured exploit traces into the Range for adversarial scenario validation
- Capture the full chain of a tool-abuse scenario with normalized, tamper-evident evidence
Blue Team Use
- Create redacted, timestamped evidence packages for AppSec review, GRC submission, and legal hold
- Build regression fixtures from real incidents to prevent recurrence
- Export control-mapped artifacts for ISO 42001, NIST AI RMF, and internal audit workflows
Defend · instrument
Runtime Trace desktop surface.
These blocks are generated from the actual Savvy desktop surfaces. The gallery keeps the product honest while giving the website a polished, screenshot-led story.
Tauri screens
Actual desktop product screens, shown as gallery blocks.
These previews are captured from the real Savvy Tauri shells and themed with the AISecurity surface language, so the product story reads as one suite across web and desktop.
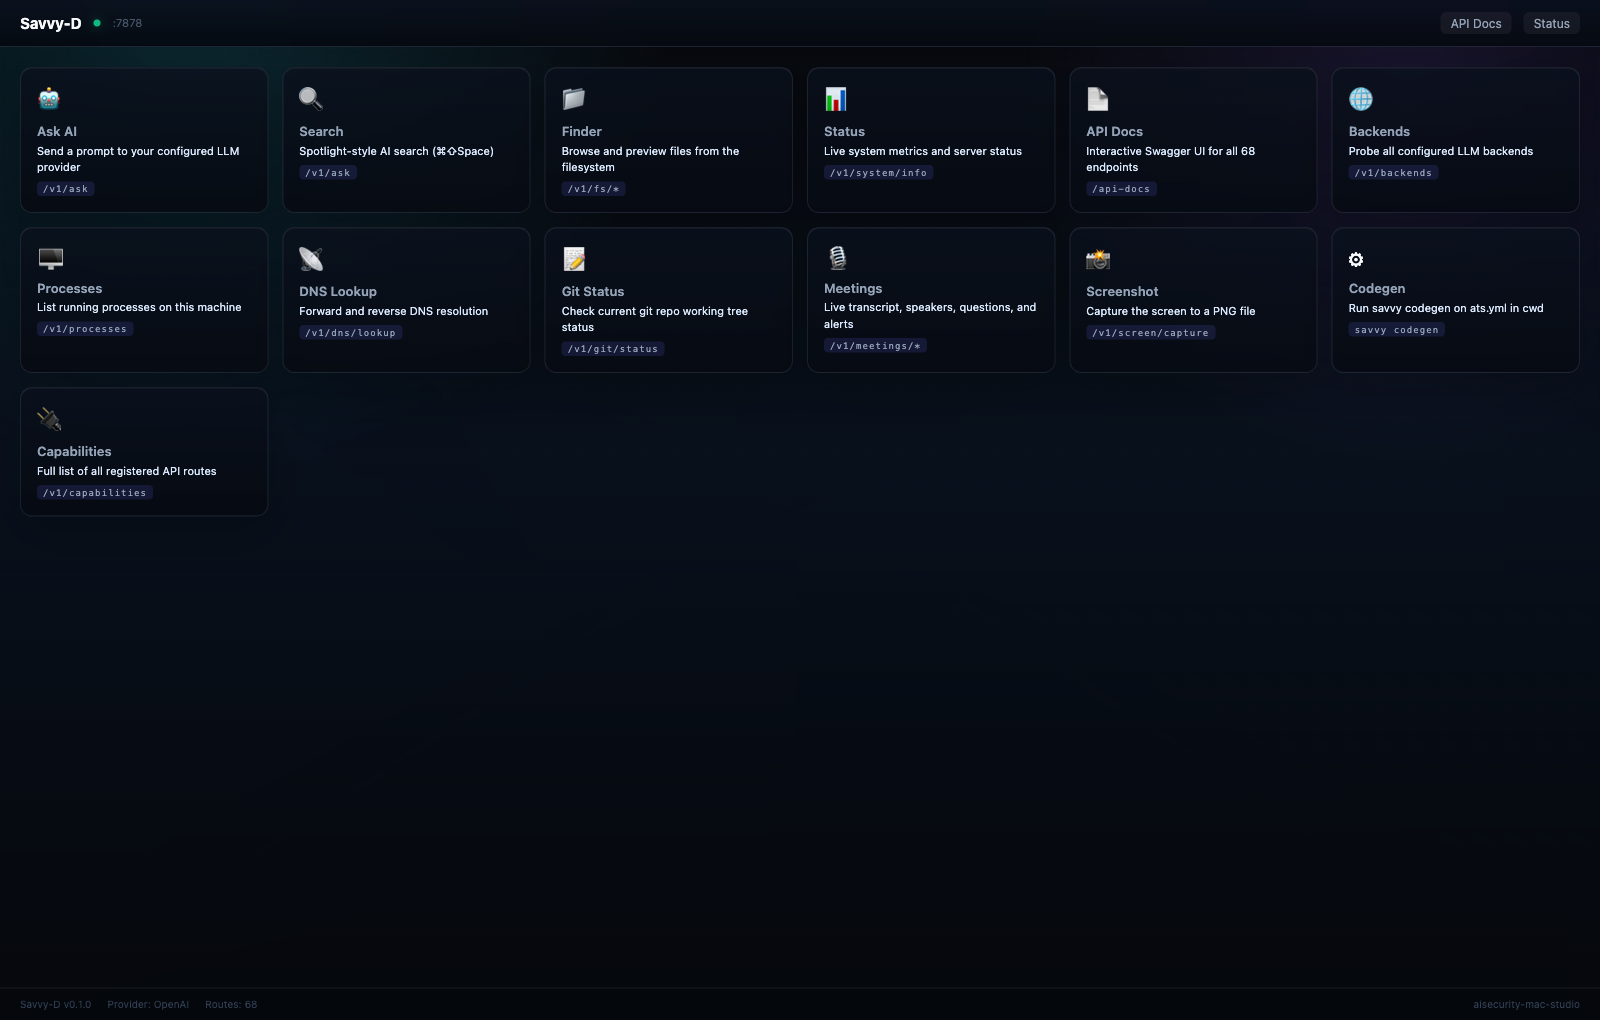
Main Dashboard
Module hub with operational status, live actions, and product blocks.
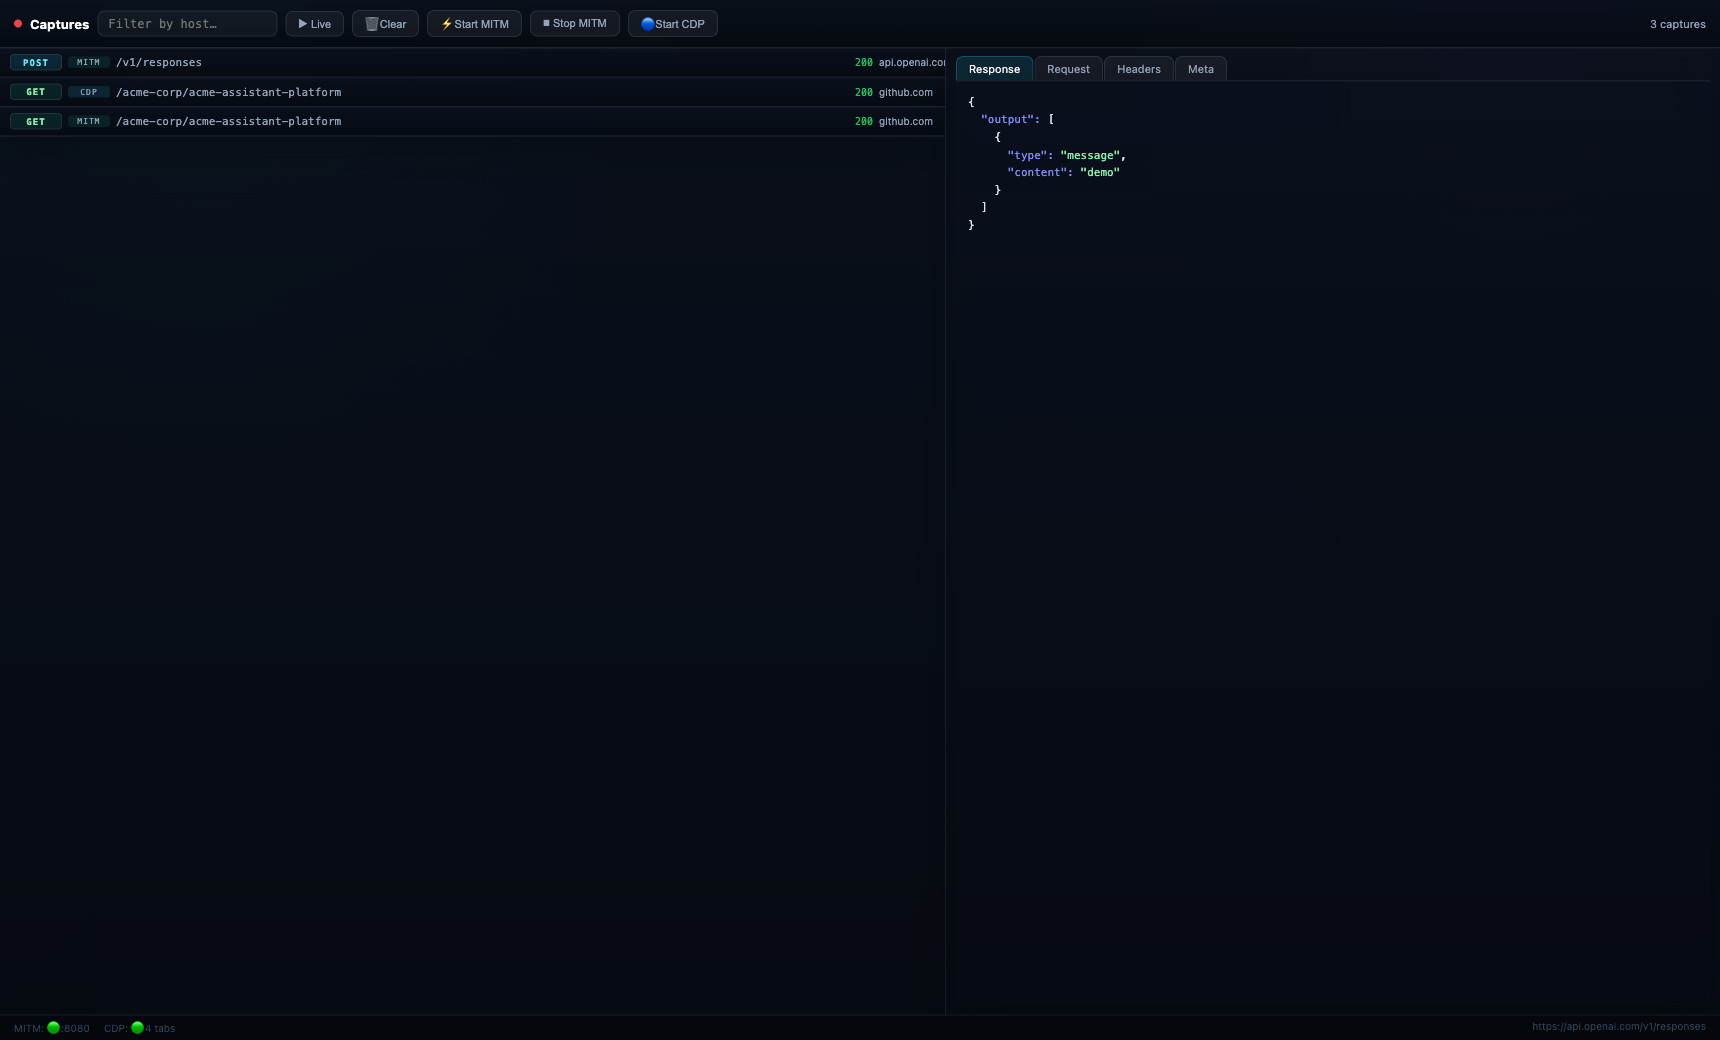
Captures Ledger
MITM + CDP traffic with request, response, and metadata inspection.
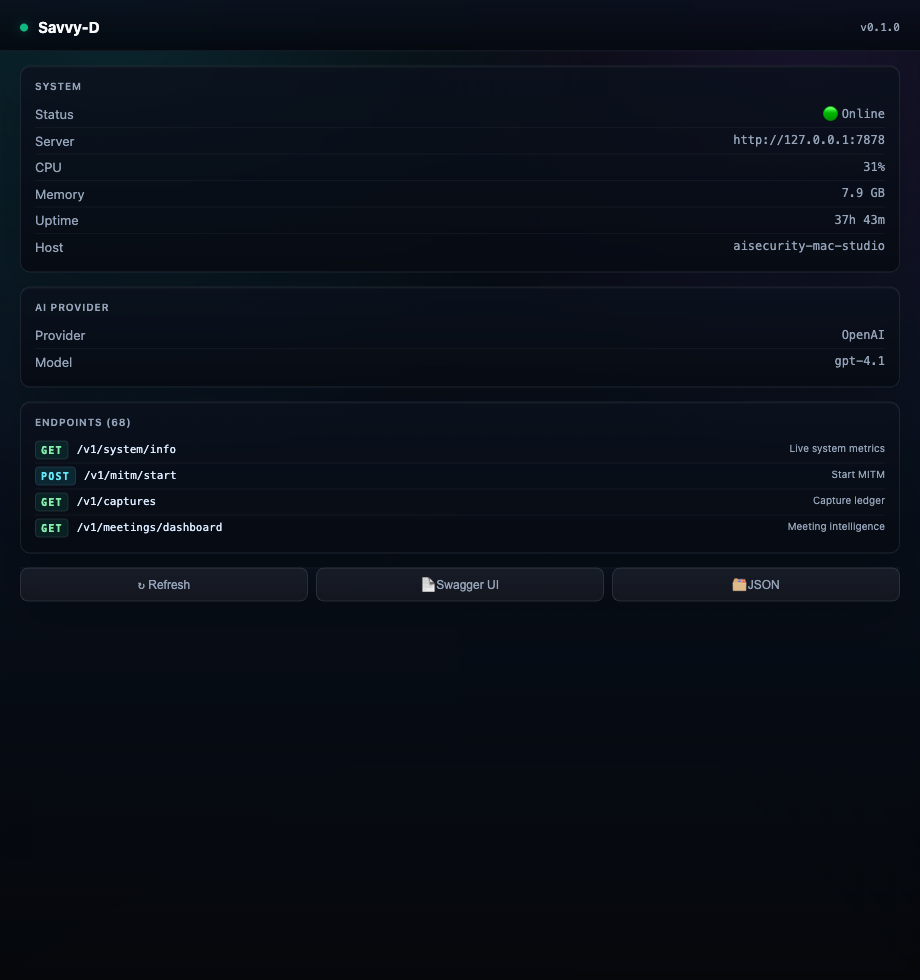
Status Console
System health, provider state, and route inventory at a glance.
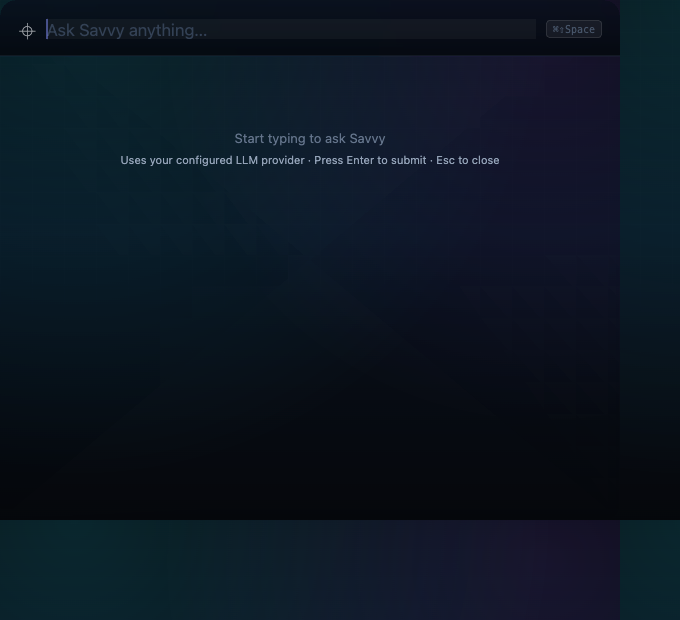
Search Palette
Compact AI prompt surface for quick operator queries.
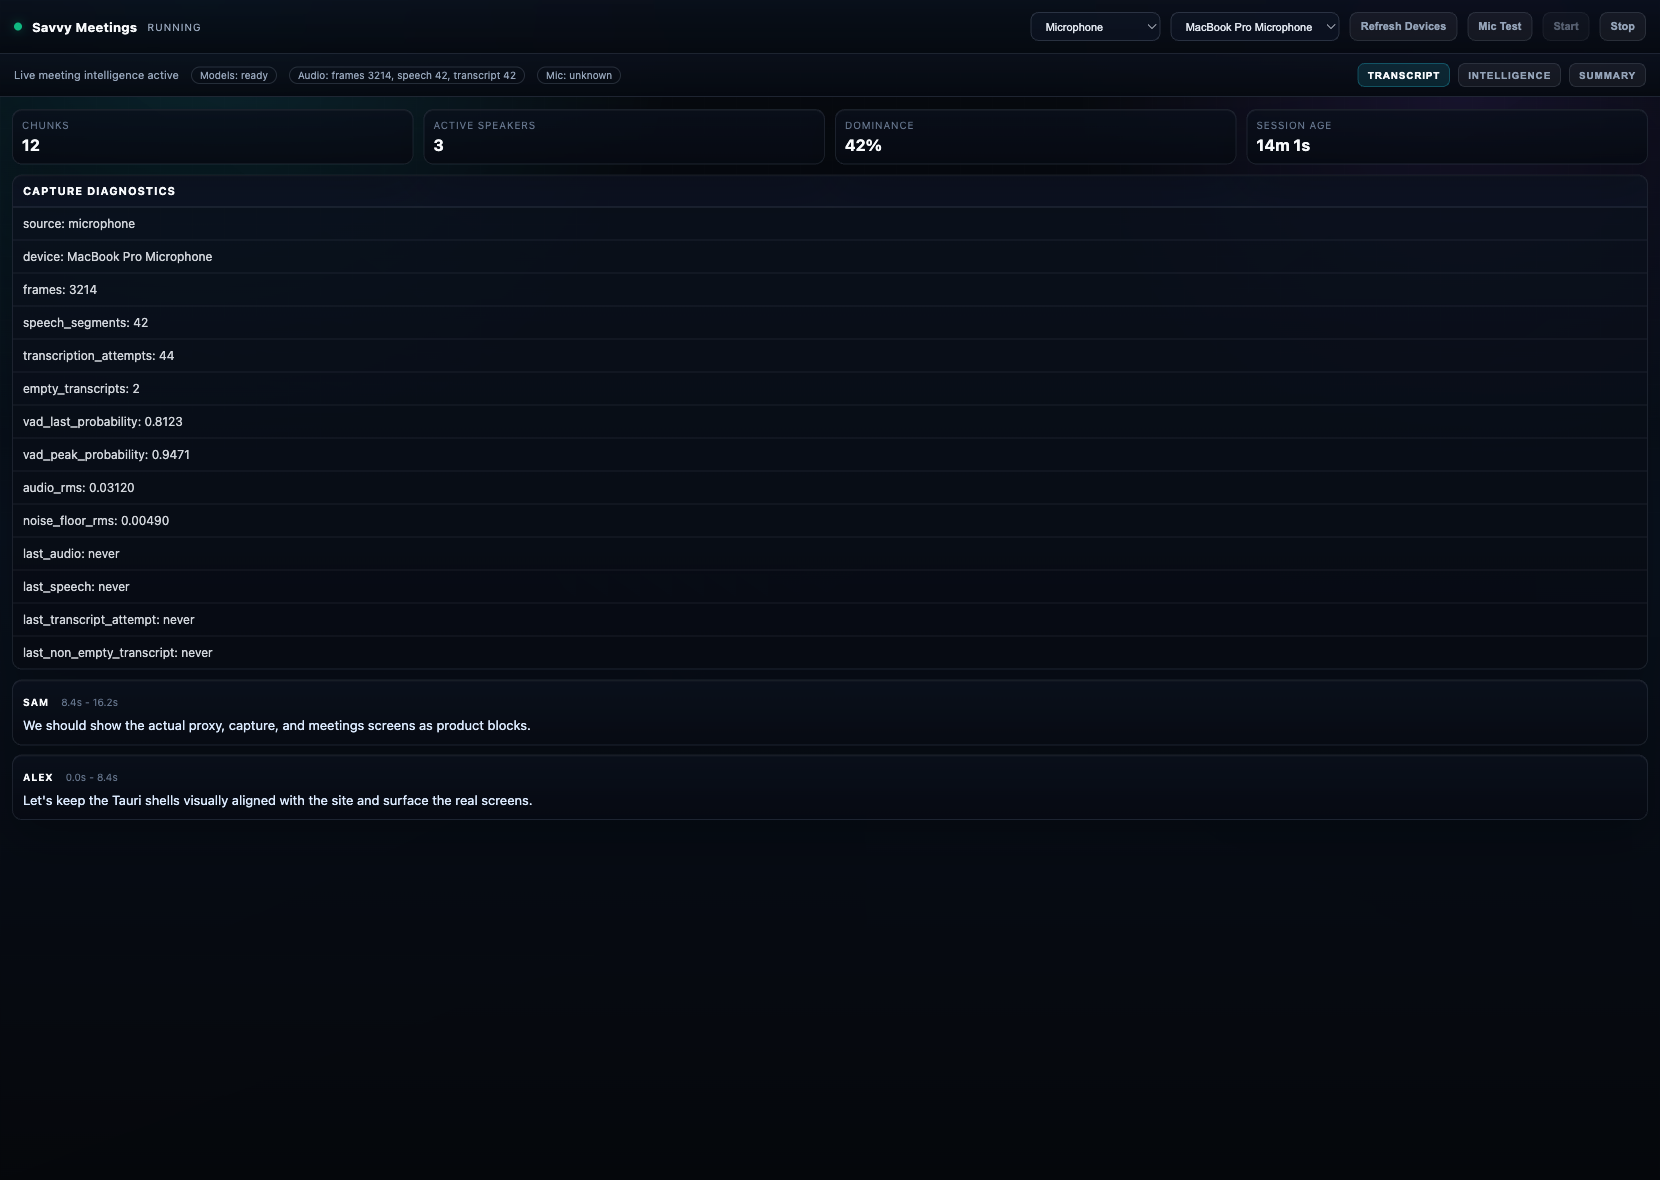
Meetings Intelligence
Transcript, speakers, risk, and action panels in a single workspace.
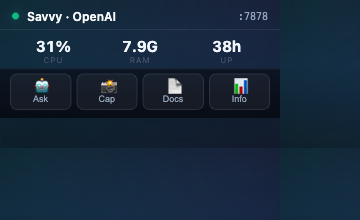
Widget Overlay
Tiny always-on-top status surface for glanceable control.
Related Workbench tools
Delivery & licensing
Available through the model that fits the product outcome.
Expert-led engagement
We capture, replay, and reconstruct supported runtime evidence directly for a scoped engagement.
Bounded partner pilot
One representative session class is captured and returned as structured evidence records for review.
OEM or licensed capability
Runtime Trace can operate as a licensed capture and evidence layer behind a partner's own runtime or observability product.
Accepts
Prompts, responses, retrieval, tool calls, and user actions in the traffic path.
Returns
Trace JSON, evidence packs, CSV control mapping, and replay files.
Current maturity
Fixture-tested
AI SECURITY WORKBENCH
Capture what the AI system actually did.
Use Runtime Trace to replay findings, retest controls, and package runtime evidence for security, GRC, legal, and customer review. Visibility depends on deployment architecture, traffic routing, instrumentation, and authorized access.